

Agency operations
The Retention Curve Every Agency Founder Should Know
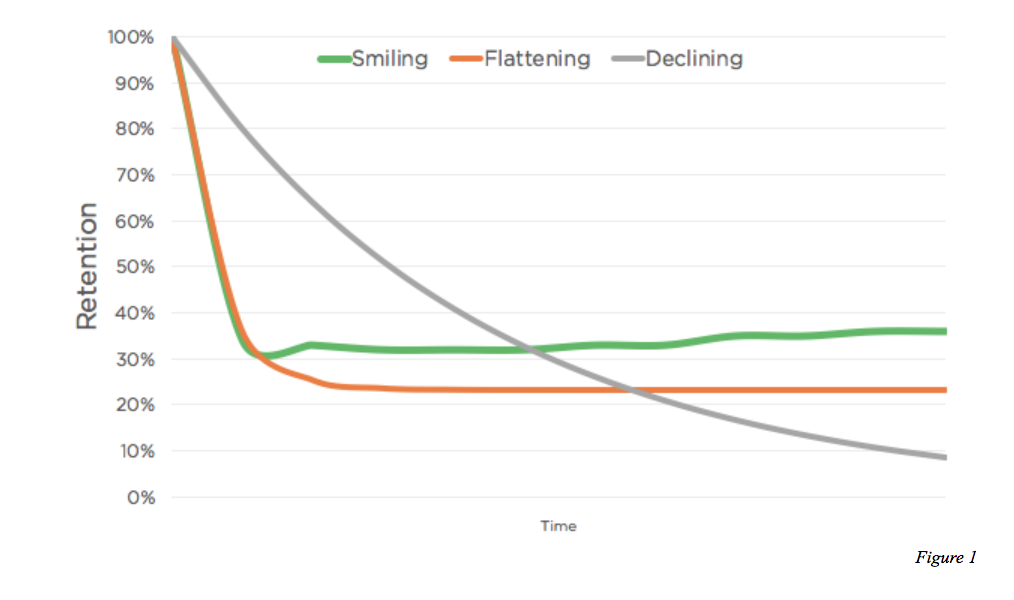
The most important indicator of whether your agency will survive might be a simple retention curve. And most agency founders have no idea what theirs looks like. They know their revenue. They know how many clients they signed this month. They know what's in the pipeline. They probably know which client is about to become a problem. But ask a much simpler question: Of the clients you sign, how many are still with you 3, 6 or 12 months later? Most agencies can't answer it. Let's learn how.
First, ignore new business
Imagine your agency signs 10 retainer clients.
For now, forget how much each client pays. Forget how many posts, videos, ads or campaigns you're producing.
We're only measuring one thing:
Did the client stay?
The month a client starts is Month 0.
At Month 0, retention is always 100%.
Then you follow that same group of clients.
If 9 are still with you one month later:
Month 1 retention = 90%
If 8 remain after three months:
Month 3 retention = 80%
If 6 remain after six months:
Month 6 retention = 60%
If only 4 remain after a year:
Month 12 retention = 40%
Plot those numbers on a graph and you get your client retention curve.
Client retention

100%  ●
      │\
 90%  │ ●
      │  \
 80%  │   ●
      │    \
 70%  │     ●
      │       \
 60%  │        ●
      │          \
 50%  │           ●
      │             \
 40%  │              ●
      │
      └──────────────────────────
       M0  M1  M3  M6  M9  M12

          Months since signing
The graph answers one question:
When we sign a client, how long do they actually stay?
That is a very different question from:
How much revenue did we make this month?
Why revenue can fool you
Imagine your agency starts the year with 10 clients.
Three clients leave over the next few months.
But your sales team signs four new ones.
You started with:
10 clients
You lost:
3 clients
You added:
4 clients
Now you have:
11 clients
From the outside, everything looks great.
Your client count grew.
Revenue might have grown.
Your monthly report is green.
You might even think:
We're growing.
But underneath, something else could be happening.
You are constantly replacing clients that leave.
Your agency isn't necessarily growing because clients love staying with you.
It could be growing because you're getting better at replacing the clients you're losing.
That's a very different business.
Think of it like filling a bucket with a hole in the bottom.
More sales means pouring water in faster.
Retention tells you how big the hole is.
So how do you calculate this for a real agency?
Clients obviously don't all sign on the same day.
You might have:
- Client A starting in January
- Client B starting in February
- Client C starting in February
- Client D starting in April
- Client E starting in June
So comparing them using calendar months doesn't tell you much.
Instead, reset the clock for every client.
The month they sign becomes Month 0.
Then:
M1 = one month after signing M2 = two months after signing M3 = three months after signing
and so on.
You're comparing clients based on how long they've been with the agency, not what month of the year it is.
This is where cohorts come in
Group clients based on when they started.
For example:
| Client cohort | M0 | M1 | M2 | M3 | M4 | M5 | M6 |
|---|---|---|---|---|---|---|---|
| January clients | 100% | 100% | 80% | 80% | 80% | 60% | 60% |
| February clients | 100% | 100% | 75% | 75% | 50% | 50% | — |
| March clients | 100% | 83% | 83% | 67% | 67% | — | — |
| April clients | 100% | 100% | 80% | 80% | — | — | — |
This is called a cohort retention table.
The — matters.
An April client who has only been with you for three months obviously can't be included when calculating six-month retention.
They haven't had the chance to reach Month 6 yet.
So when you calculate M6 retention, only include clients who are at least six months old.
Turn the table into one curve
Once you have enough cohorts, you can combine them.
You might discover that across your agency:
| Time since signing | Client retention |
|---|---|
| Month 0 | 100% |
| Month 1 | 92% |
| Month 2 | 86% |
| Month 3 | 78% |
| Month 6 | 63% |
| Month 9 | 54% |
| Month 12 | 47% |
Now you have something far more useful than a normal client-count chart.
You have the shape of the average client relationship at your agency.
And the shape matters
Imagine two agencies.
Both sign roughly the same number of clients.
Both have similar revenue.
But their curves look very different.
Agency A
100% ●
     │\
 90% │ ●──●──●
     │       \
 80% │        ●────●────●
     │
     └────────────────────
       0  1  3  6  9  12
Most clients stay.
After the early drop-off, the curve starts flattening.
That's interesting.
It suggests that once a client survives the first few months, they're likely to stick around.
Agency B
100% ●
     │\
 80% │ ●
     │   \
 60% │     ●
     │       \
 40% │         ●
     │           \
 20% │             ●
     │
     └────────────────────
       0  1  3  6  9  12
This agency has a very different problem.
They're bringing clients through the front door while existing clients keep walking out the back.
They may still be growing.
But growth is getting more expensive every month.
Look for where your curve drops
The interesting part isn't just the final percentage.
It's where the drop happens.
If you see:
100% → 70% in the first month
You probably don't have a long-term retention problem yet.
You may have a sales or onboarding problem.
Maybe the wrong expectations were set.
Maybe the client wasn't a good fit.
Maybe the handoff from sales to delivery is bad.
Maybe the client bought something different from what the team thought they were supposed to deliver.
If you see:
100% → 95% → 93% → 90% → then a big fall around Month 3
That's another signal.
Maybe your initial enthusiasm carries the relationship.
Then the client starts questioning the value.
Maybe reporting isn't clear.
Maybe the strategy stops evolving.
Maybe the agency starts becoming an execution vendor instead of a partner.
If the curve stays strong until Month 6 and then consistently drops:
You have another question to investigate.
What happens around Month 6?
Maybe contracts renew.
Maybe campaigns become repetitive.
Maybe clients bring the function in-house.
Maybe results plateau.
The retention curve doesn't tell you why clients leave.
It tells you where to look.
And that's incredibly valuable.
The number I would ask every agency founder
Not:
How many clients do you have?
Not:
What's your MRR?
Not even:
How many clients did you sign this quarter?
I'd ask:
Of every 10 retainer clients you sign, how many are still with you six months later?
Because imagine two ₹1 crore agencies.
Agency A signs 20 clients every year and keeps 18.
Agency B signs 40 clients every year and loses 20.
They can show the same revenue today.
But they are not the same business.
One has compounding relationships.
The other has a sales treadmill.
Start with four numbers
You don't need complicated analytics software.
Open a spreadsheet.
List every retainer client you've had.
Add:
Client name Start date End date — blank if they're still active
Then calculate:
1-month retention
Of clients old enough to have reached one month, what percentage were still with you?
3-month retention
Of clients old enough to have reached three months, what percentage survived three months?
6-month retention
Of clients old enough to have reached six months, what percentage survived six months?
12-month retention
Of clients old enough to have reached twelve months, what percentage survived one year?
That's enough to start.
You might end up with:
M1 — 94% M3 — 82% M6 — 68% M12 — 51%
Now plot them.
You have your retention curve.
Then add revenue retention
Once you understand client retention, there's one more layer worth adding.
Because every client isn't equal.
Imagine you have 10 clients.
Nine pay ₹50,000/month.
One pays ₹4,00,000/month.
If the big client leaves, your client retention might still look excellent.
You retained:
9 out of 10 clients = 90%
But you lost almost half your retainer revenue.
So eventually I would track two curves:
Client retention
How many relationships survived?
and
Revenue retention
How much of the original recurring revenue survived?
The first tells you about your client relationships.
The second tells you about the financial impact of those relationships.
But start with the simple curve
Don't turn this into another dashboard project.
Take your retainer clients.
Put every one of them at Month 0.
Track whether they're still there at Month 1, Month 3, Month 6 and Month 12.
Plot it.
Then look at the shape.
Because if your agency has to acquire a new client every time an old one leaves, you're not really building on top of last month's work.
You're rebuilding last month.
And eventually sales gets harder.
The founder gets tired.
Acquisition costs rise.
The team keeps onboarding new accounts.
Knowledge constantly leaves.
Forecasting becomes painful.
Revenue becomes unpredictable.
That's why retention matters so much.
New business tells you how fast you're moving.
Retention tells you whether any of that movement is actually compounding.